Following some wisely proffered advice from my lovely wife, I decided to add some smooth, animated statistic bars for the statistics able to support them in an early effort to begin beautifying the Statistics module for Vision, which is my newly developed game overlay presentation platform that grants vision into the inner workings of games hacked with Bad Echo tech (which includes games that are Omnified).
I’ve never had to make something like a “health bar” in a WPF user interface before, so it was an interesting little activity to engage in. On top of that, I think the results are rather lovely.
How’d I do it? Let’s dive into that now.
Visualizing Game Statistics in Metered Form
Vision‘s beauty, in my opinion, is in its responsiveness, simplicity, and readability. That’s all well and good, but gamers and all other fickle audience members out there need a bit more pizzaz and shine to their gaming interfaces. Otherwise, they’ll just see something like Vision as just a bunch of stupid floating text.
But who cares about them! Believe it or not, I love shiny cool looking things too. So, when my wife mentioned it’d be neat to have fractional statistics sport an additional visual representation as a replenishing and depleting bar, I immediately said to her, “You’re right! We’ll do it now!”
Well, actually at first I held my hands up, rejecting the criticism and saying it looks fabulous in its current form, referencing the beauty in its simplicity, etc. Ten seconds later, I came to my senses, as I usually do, and decided to whip up a way to have controls that act like health bars rendered in a WPF interface.
Representation of fractional game statistics in bar form is a staple of gaming in general, so it made sense to have that sort of thing implemented in Vision. Got to make it look sexy for the demanding public, right?
At the time of writing, prior to implementing the “health” bar visuals, a fractional statistic view was defined as follows:
FractionalStatisticView.xaml (before)
<badEcho:View x:Class="BadEcho.Vision.Statistics.Views.FractionalStatisticView"
              xmlns="http://schemas.microsoft.com/winfx/2006/xaml/presentation"
              xmlns:x="http://schemas.microsoft.com/winfx/2006/xaml"
              xmlns:mc="http://schemas.openxmlformats.org/markup-compatibility/2006"
              xmlns:d="http://schemas.microsoft.com/expression/blend/2008"
              xmlns:badEcho="http://schemas.badecho.com/presentation/2022/02/xaml"
              xmlns:vm="clr-namespace:BadEcho.Vision.Statistics.ViewModels"
              mc:Ignorable="d">
    <d:DesignProperties.DataContext>
        <vm:FractionalStatisticViewModel Name="Player Health"
                                         CurrentValue="86"
                                         MaximumValue="1000"
                                         />
    </d:DesignProperties.DataContext>
    <Grid Style="{StaticResource StatisticCompactableGridStyle}">
        <badEcho:OutlinedTextElement Style="{StaticResource StatisticNameTextStyle}"
                                     Text="{Binding Name}"
                                     Grid.Column="0"
                                     Grid.Row="0"
                                     />

        <StackPanel Orientation="Horizontal"
                    Grid.Column="1"
                    Grid.Row="1">
            <badEcho:OutlinedTextElement Style="{StaticResource StatisticTextStyle}"
                                         Text="{badEcho:SteppedBinding CurrentValue,
                                                        SteppingDuration=00:00:02,
                                                        MinimumSteps=10}"
                                         />
            <badEcho:OutlinedTextElement Style="{StaticResource StatisticTextStyle}"
                                         Text="/"
                                         />
            <badEcho:OutlinedTextElement Style="{StaticResource StatisticTextStyle}"
                                         Text="{badEcho:SteppedBinding MaximumValue,
                                                        SteppingDuration=00:00:02,
                                                        MinimumSteps=10}"
                                         />
        </StackPanel>
    </Grid>
</badEcho:View>
Which yields the following look:
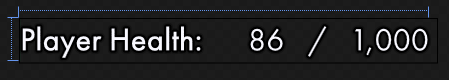
So, in order to make a bar out of it, we’ll want to have a color behind the text that will somehow decrease as the fractional statistic’s percentage value (which is the current value divided by the maximum value) gets smaller, and increase when the opposite occurs.
How to do this in WPF?
The Obvious Way To Make a Health Bar in WPF
The first method we may think of for implementing the visual bar look for our stats will probably be something along the lines of placing a Border control behind the statistic view’s main Grid with its foreground brush set to some sort of color for the bar.
The replenishing/depletion action of the bar would then be achieved by binding the width of the Border to a view model property exposing the percentage value for the statistic, processed by some sort of IValueConverter. As the percentage for the statistic decreases, so too would the width of the bar, and vice versa.
I didn’t like this way for a number of reasons, the primary one having to do with control layout concerns. The cleanest approach, layout wise, would be to have the Border surrounding the core Grid not only visually, but also logically. Meaning, the Border would become the root control of the view, and the Grid would become its child or content.
This wouldn’t be possible if we were to bind the Border‘s width to the fractional statistic value, as changing the Border‘s width would then cause everything else (i.e., the text and numbers) to shrink too. We would need to add the Border as a child of the Grid, spanning all rows and columns.
That is just a whole bunch of blah. Plus, I wanted the bar effect to look sexier than just a simplistic shrinking color block. So, after tooling around for a bit, I came up with an idea.
Bar Visualization via Gradient Boundary Shifting
Instead of shrinking the Border‘s width, why not achieve a means of depletion through a bit of manipulation to the LinearGradientBrush being used as the foreground? We could create a few gradient stops that would define the actual color gradient for the bar (in regards to what colors it should have when full), and then add a final gradient stop that was completely transparent.
Then, when we need to deplete the bar a bit, all we need to do is lower the ending coordinate points of the gradient by manipulating the EndPoint property. This would result in that final, transparent, gradient stop taking up more space on the bar.
Of course, wouldn’t this transparent gradient stop prevent us from ever having a full bar? Normally yes, but we can get around that simply by implementing a kind of reverse-cascade which would cause the end point to be increased enough past the default value of 1.0 so that the transparent gradient stop had no presence on the bar at all.
As soon as the fractional statistic falls beneath under 100% of its maximum value, the end point is immediately cascaded back down to normal levels, from there, we have a fairly direct visual relationship between the EndPoint value and the fractional statistic’s percentage value. Indeed, setting the EndPoint to 0.8, for example, will make it appear as if the bar is around 80% full.
The closer the secondary gradient stop’s offset is to 100%, the more accurate the relationship is between the EndPoint value and the actual % of bar that gets filled up.
All of this also requires proper configuration of the various non-transparent gradient stop offsets, however. Don’t worry! It’s very simple: just have the secondary gradient stop’s offset very close to the transparent gradient stop.
Converting Percentages to Point Values
A key player here will be a new IValueConverter implementation, namely something we’ll be calling a PercentageToPointConverter. This will take incoming percentage doubles and convert them into Point values.
We’ll want to have separate ratios and shifter values for both x- and y-coordinate values, as (in this particular use case with the visual bars) we’ll actually want y-coordinate values to be 0 so we can have straight, vertical lines in our bars.
PercentageToPointConverter.cs
/// <summary>
/// Provides a value converter that converts provided percentage values to a corresponding
/// x- and y-coordinate pair in two-dimensional space.
/// </summary>
public sealed class PercentageToPointConverter : ReversibleValueConverter<double,Point>
{
    /// <summary>
    /// Gets or sets the relationship between incoming percentage values and the x-coordinates
    /// they are to be converted into.
    /// </summary>
    /// <remarks>
    /// A ratio of 1 to 1 (which the default value of 1.0 represents) would result in an incoming
    /// percentage value of 50% (0.5) being converted to a point where the x-coordinate is set to
    /// 0.5.
    /// </remarks>
    public double PercentageToXRatio
    { get; set; } = 1.0;

    /// <summary>
    /// Gets or sets the relationship between incoming percentage values and the y-coordinates they
    /// are to be converted into.
    /// </summary>
    /// <remarks>
    /// A ratio of 1 to 1 (which the default value of 1.0 represents) would result in an incoming
    /// percentage value of 50% (0.5) being converted to a point where the y-coordinate is set to
    /// 0.5.
    /// </remarks>
    public double PercentageToYRatio
    { get; set; } = 1.0;

    /// <summary>
    /// Gets or sets the point value cascade amount that occurs when incoming percentage values
    /// transition from whole amounts to proper fractional values.
    /// </summary>
    /// <remarks>
    /// <para>
    /// The relationship between incoming percentage values and the converted point values
    /// essentially linear, except when the input percentages begin to fall underneath whole
    /// amounts and become fractional, which would be anything less than 100% (0.1). When this
    /// occurs, a cascade can be applied which will apply an immediate reductionary adjustment
    /// equal to this property's value.
    /// </para>
    /// <para>
    /// In the opposite case, where incoming percentage values cross from fractional to whole,
    /// a reverse cascade is applied. The default amount this is set to is 0, which means, by
    /// default, no cascading occurs.
    /// </para>
    /// <para>
    /// An input value is considered "fractional" if it is a proper fraction, improper fractions
    /// are excluded from any type of cascading effect, as they are essentially "whole amounts and
    /// then some". Yes, excellent use of proper nomenclature, I know.
    /// </para>
    /// </remarks>
    public double FractionalCascadeAmount
    { get; set; }

    /// <inheritdoc/>
    protected override Point Convert(double value, object parameter, CultureInfo culture)
    {
        if (value >= 1.0)
            value += FractionalCascadeAmount;

        double xCoordinate = value * PercentageToXRatio;
        double yCoordinate = value * PercentageToYRatio;

        return new Point(xCoordinate, yCoordinate);
    }

    /// <inheritdoc/>
    protected override double ConvertBack(Point value, object parameter, CultureInfo culture)
    {
        // Not going to bother too much with intense validation here, as we don't want to ever
        // throw errors in an IValueConverter. We assume the point value was created by this
        // converter, and convert the value back based on the looking at the first coordinate
        // point we come across.
        double percentage = value.X / PercentageToXRatio;

        if (percentage >= 1.0 + FractionalCascadeAmount)
            percentage -= FractionalCascadeAmount;

        return percentage;
    }
}
Converting Hex Values to Colors
The previous IValueConverter is the real star of the show, however there were a few other cogs I needed to add to get this contraption moving. In particular, I needed a way to bind colors associated with a statistic to their corresponding gradient stops.
I didn’t want to have just a single set of colors in use here, so I figured it’d be best to have the colors defined at the statistic level, which means within either the Omnified framework or the targeted game’s hacks. I’d add two parameters to the fractional statistic “constructor” and then the colors could be configured like so (in statisticMessages.lua, obviously it would be in a target-specific file for game-specific statistics):
statisticMessages.lua
local statistics = {
        FractionalStatistic("Health", playerHealth, playerMaxHealth, "#CC43BC50", "#CC27D88D"),
        FractionalStatistic("Stamina", playerStamina, playerMaxStamina, "#CCE4C11B", "#CCF8E33A"),
.
.
.
So, we’d need to add two new properties to our FractionalStatisticViewModel, which would hold the hex strings for these desired ARGB values. Even though we deal a lot with hex strings when specifying colors in XAML, binding a string to a color doesn’t work — we’ll need a separate value converter for that.
HexadecimalToColorConverter.cs
/// <summary>
/// Provides a value converter that converts provided hexadecimal <see cref="string"/> values to
/// <see cref="Color"/> values.
/// </summary>
[ValueConversion(typeof(string), typeof(Color))]
public sealed class HexadecimalToColorConverter : ValueConverter<string,Color>
{
    /// <inheritdoc/>
    protected override Color Convert(string value, object parameter, CultureInfo culture)
    {
        try
        {
            return (Color) ColorConverter.ConvertFromString(value);
        }
        catch (FormatException)
        {   // If this kind of exception is thrown, then input is not a valid color identifier.
            // Don't want to propagate errors in an IValueConverter, so we just return transparent.
            return Colors.Transparent;
        }
    }

    /// <inheritdoc/>
    protected override string ConvertBack(Color value, object parameter, CultureInfo culture)
        => $"{value.A:X2}{value.R:X2}{value.G:X2}{value.B:X2}";
}
Bringing It All Together
There were some additional (deep) changes I had to make, like making my awesome SteppedBinder class support stepping double values (previously it just supported incrementing/decrementing integer values), which gives us the “animated” look.
Not going to cover that in this article. Here’s the updated code for our FractionalStatisticView, putting to use all the stuff I talked about.
FractionalStatisticView.xaml
<badEcho:View x:Class="BadEcho.Vision.Statistics.Views.FractionalStatisticView"
              xmlns="http://schemas.microsoft.com/winfx/2006/xaml/presentation"
              xmlns:x="http://schemas.microsoft.com/winfx/2006/xaml"
              xmlns:mc="http://schemas.openxmlformats.org/markup-compatibility/2006"
              xmlns:d="http://schemas.microsoft.com/expression/blend/2008"
              xmlns:badEcho="http://schemas.badecho.com/presentation/2022/02/xaml"
              xmlns:vm="clr-namespace:BadEcho.Vision.Statistics.ViewModels"
              mc:Ignorable="d">
    <d:DesignProperties.DataContext>
        <vm:FractionalStatisticViewModel Name="Player Health"
                                         CurrentValue="800"
                                         MaximumValue="1000"
                                         PercentageValue="0.8"
                                         PrimaryBarColor="#FF43BC50"
                                         SecondaryBarColor="#FF27D88D"
                                         />
    </d:DesignProperties.DataContext>
    <badEcho:View.Resources>
        <badEcho:HexadecimalToColorConverter x:Key="HexadecimalColorConverter" />
        <!--
            Since we're shifting the gradient horizontally, we zero out the y-axis so we have
            straight vertical lines.
        -->
        <badEcho:PercentageToPointConverter x:Key="PercentagePointConverter"
                                            FractionalCascadeAmount="0.5"
                                            PercentageToXRatio="1.07"
                                            PercentageToYRatio="0"
                                            />
        <LinearGradientBrush x:Key="GaugeBackground"
                             EndPoint="{badEcho:SteppedBinding PercentageValue,
                                               SteppingDuration=00:00:01,
                                               StepAmount=0.001,
                                               Converter={StaticResource PercentagePointConverter}}">
            <GradientStop Color="{Binding PrimaryBarColor,
                                          Converter={StaticResource HexadecimalColorConverter}}"
                          Offset="0"
                          />
            <GradientStop Color="{Binding SecondaryBarColor,
                                          Converter={StaticResource HexadecimalColorConverter}}"
                          Offset="0.97"
                          />
            <GradientStop Offset="1"
                          Color="#00000000"
                          />
        </LinearGradientBrush>
    </badEcho:View.Resources>
    <Border Background="{StaticResource GaugeBackground}"
            Padding="0,0,5,0"
            Margin="0,0,0,1">
        <!--
            The tiny bit of margin is in case there are multiple fractional statistics stacked on
            top of each other. We want a tiny bit of separating space in that case.
        -->
        <Grid Style="{StaticResource StatisticCompactableGridStyle}">
            <badEcho:OutlinedTextElement Style="{StaticResource StatisticNameTextStyle}"
                                         Text="{Binding Name}"
                                         Grid.Column="0"
                                         Grid.Row="0"
                                         />
            <StackPanel Orientation="Horizontal"
                        Grid.Column="1"
                        Grid.Row="1">
                <badEcho:OutlinedTextElement Style="{StaticResource StatisticTextStyle}"
                                             Text="{badEcho:SteppedBinding CurrentValue,
                                                            SteppingDuration=00:00:01,
                                                            MinimumSteps=10,
                                                            IsInteger=True}"
                                             />
                <badEcho:OutlinedTextElement Style="{StaticResource StatisticTextStyle}"
                                             Text="/"
                                             />
                <badEcho:OutlinedTextElement Style="{StaticResource StatisticTextStyle}"
                                             Text="{badEcho:SteppedBinding MaximumValue,
                                                            SteppingDuration=00:00:01,
                                                            MinimumSteps=10,
                                                            IsInteger=True}"
                                             />
            </StackPanel>
        </Grid>
    </Border>
</badEcho:View>
Here’s the updated look for this control at design-time:

A Brief Commentary on the Settings
For the secondary gradient stop, we’re using an offset of 0.97. While 0.99 will give us the closest possible “cut-off” between color and no-color (allowing for the most accurate EndPoint vs actual percentage of bar full), I lowered it a tiny smidge so we have a bit of a wispy “trail” at the end of the bar. Because that looks nice.
The stepping duration for the colored bar portion is set to one second, and the stepping durations for the textual portions of the statistic view have also been lowered to one second for reasons of parity. This makes them a bit faster in terms of update speed, but this doesn’t affect the other statistic types, so all is well.
I haven’t written anything about the magic behind my SteppedBinding, maybe I will sometime.
Also, for the smoothest updates and best real-time reflection of game data, I experimented with lowering the statistic message file write interval to 50 milliseconds, and that seems to work out great.
A lot of this probably will only make sense to someone familiar with all of this Bad Echo technology and the Omnified framework; regardless, I’ve written it down for posterity.
To see the animated bars in action, refer to the very first image I included at the top of this article!
Or, better yet, check out the Omnified action live, on my stream! I’ll be debuting this technology on my channel shortly after posting this article.